📝KSA Data for the '25-'26 school year is HERE and we couldn't be more proud of the gains made by Shelby County students!
As we prepare to dive deeper into successes over the coming weeks, we want to leave you with two big accomplishments to be proud of:
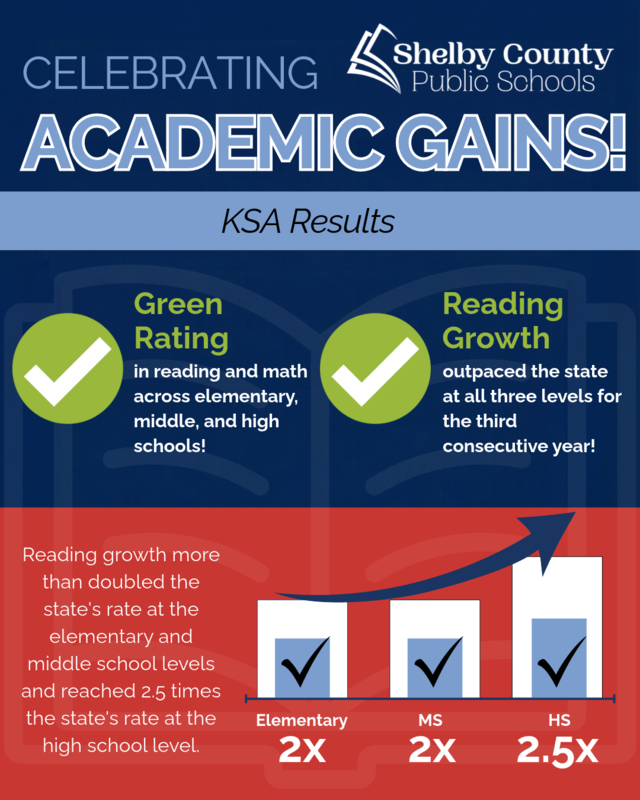
SCPS Elementary, Middle, and High School students all received GREEN ratings in Reading and Math (the second highest rating from the KY Department of Education)
Across all three levels, the district’s three-year growth in reading beat the state average. Reading growth was more than DOUBLE the state’s at elementary and middle school, and 2.5x the state’s at the high school level!
This and so much more is a testament to the effort put in by our students every day, as well as the support they receive from the SCPS staff and all our parents and guardians! The effort is paying off and it SHOWS!👏
Watch this video from Superintendent Dr. Matthews as he dives deeper into the accomplishments made individually at the elementary, middle, and high school levels (outlined below!)
Elementary
Reading growth more than double the state’s rate.
The district gained 7 points (39 → 46) over three years, while the state gained 3 (47 → 50). The gap to the state shrank from 8 points to 4.
Three Consecutive years of reading growth
Social studies grew while the state declined.
The district gained 7 points (25 → 32) over three years, while the state slipped 1 (39 → 38). The gap to the state narrowed from 14 points to 6.
Writing grew while the state declined.
The district gained 6 points (28 → 34) over three years, while the state dropped 2 (43 → 41). The gap to the state was cut by more than half, from 15 points to 7.
Middle School
Reading growth more than double the state’s rate.
The district gained 7 points (35 → 42) over three years, while the state gained 3 (45 → 48). (Slide 32)
Three Consecutive years of reading growth
Writing jumped 11 points in one year
35 to 46, while the state dipped from 48 to 47. Middle school writing is now within 1 point of the state.
Math growth held steady while the state’s growth dipped.
The district has gained each year (32 → 33 → 34), while the state fell from 41 to 40 this year.
High School
Reading growth was 2.5x the state’s rate.
The district gained 10 points (33 → 43) over three years, compared with the state’s 4. The gap to the state was cut from 12 points to 6.
Three Consecutive years of reading growth
Math grew while the state’s dipped.
The district gained 6 points (30 → 36) over three years, compared with the state’s 4. This year the district rose 1 point while the state fell 2, so the gap to the state is down to 3 points.
The four-year graduation rate rose 4.7 points in one year, from 87.8% to 92.5%. The state rose 0.6 points over the same year.